Ghost Debugging 3: Stepping Through Code
Previously in Ghost Debugging 2: Remote Development Setup we saw how to configure and run an additional Ghost development instance on a Linux server.
This post focuses on the call stack associated with the initiation of a Node.js application as seen by the Chrome debugger connected to a Node.js server process.
Entry point for user code
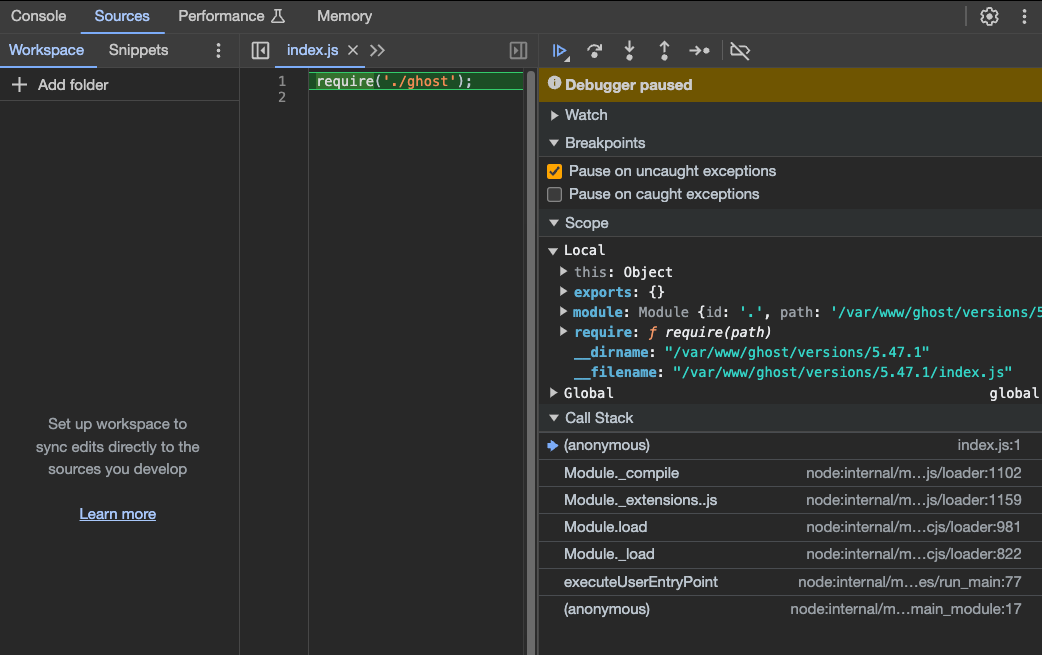
Here's the state of a Ghost instance that was started with --inspect-brk. This is the first user instruction Node.js runs.
Node:internal
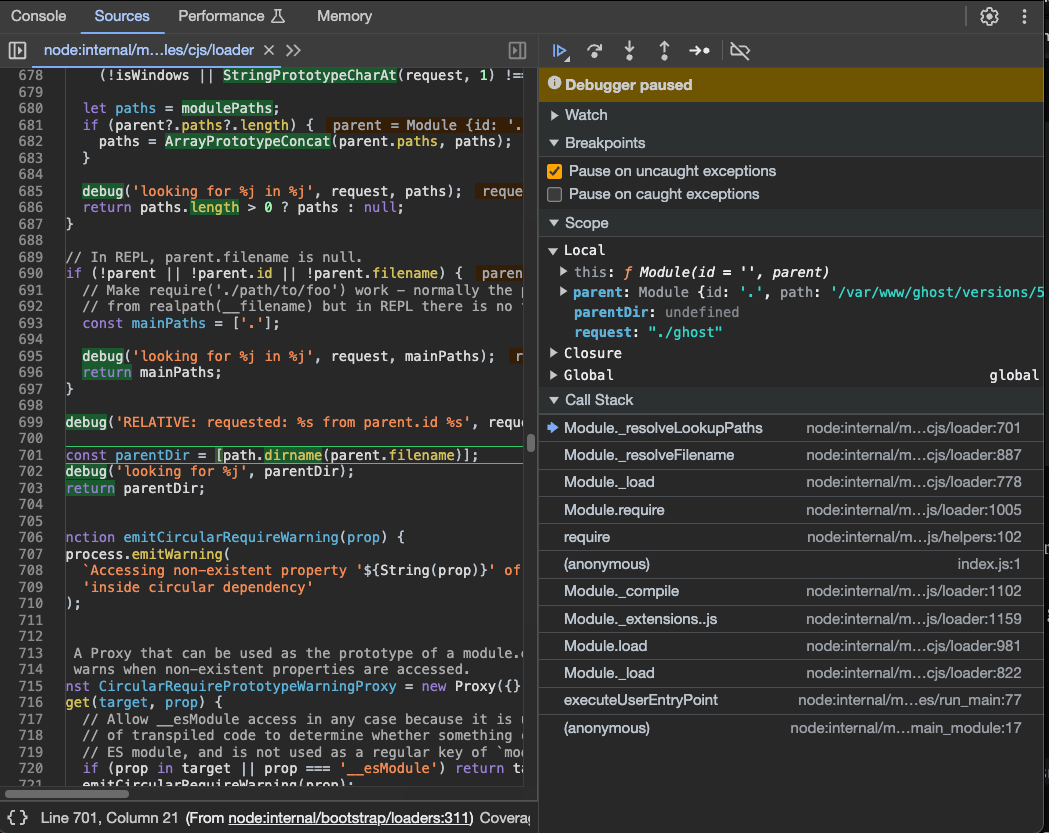
Here is the call stack after stepping about 25 times. Note that the original require('index.js') is in the middle of the call stack- node:internal is the bootstrap code that Node.JS always runs.
Boot Ghost
We want all of the node:internal stuff to finish up and to stop right before ghost starts. To do this, type cmd+P to popup the open file dialog in Chrome DevTools and type /var/www/ghost/versions/5.47.1/core/boot.js
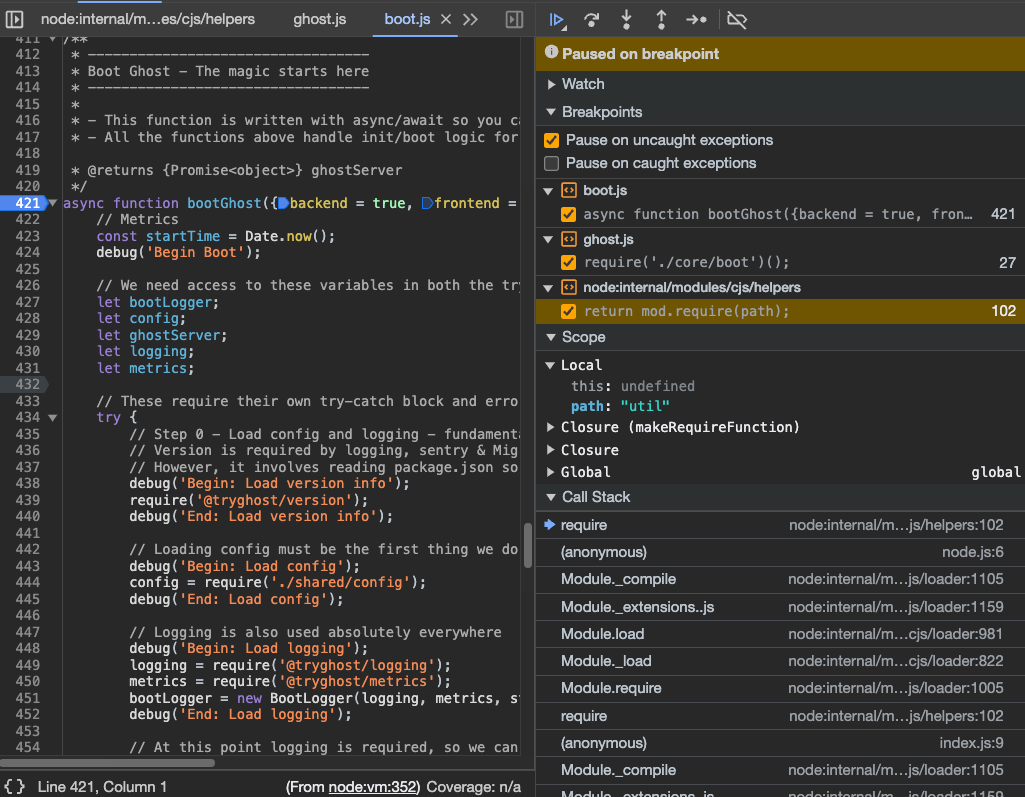
Put a break point on bootGhost(...) and run to the break point. Now you can single step through the entire initialization of Ghost and see how the gears turn.
For now let's get to the task at hand: Ghost Debugging 4: SMTP Email Bug.