Ghost Debugging 2: Remote Development Setup
Previously in Ghost Debugging 1: Overview we saw how to login, look at configuration data and how to view log info. We saw an SMTP email server refusing Ghost's request to send mail on behalf of [email protected].
In this post we cover duplicating the database, editing the config.development.json, creating SSH tunnels and starting services to allow us to step through server side Node.js code with the Chrome DevTools debugger.
Setting up debug environment
We want to debug the Node.js code so we need to start Ghost manually and separately from production.
First, clone the database:
  mysqldump -u root ghost_prod > ghost_dev.sql
  mysql -u root ghost_dev < ghost_dev.sql
bash
Clone the production database for development
-
Second, clone the content:
sudo cp -r /var/www/ghost/content /var/www/ghost/content_dev
sudo chown -R  ghost:ghost /var/www/ghost/content_dev
bash
Clone production content for development
-
Third, start a local port forward tunnel for the development application instance. This listens for a local web client to connect to GHOST_DEV_PORT_LOCAL and sends that on to sshd on ghostIp which sends internally to 127.0.0.1:PORT_REMOTE which normally is not exposed to public.
  ssh -nNT -L \
    $GHOST_DEV_PORT_LOCAL:127.0.0.1:$GHOST_DEV_PORT_REMOTE \
    root@$ghostIp
bash
Start a tunnel from developer version of web service, see lximiuz
-
Forth, start another local port forward for the debug data generated by Node.js and received by Chrome:
  ssh -nNT -L \
    $GHOST_DEBUG_PORT:127.0.0.1:$GHOST_DEBUG_PORT \
    root@$ghost
bash
Start a tunnel for debugger connection
-
Fifth, start debug version in the foreground. Ghost uses ghost.development.json when NODE_ENV=development.
    cd /var/www/ghost;
    NODE_ENV=development NODE_OPTIONS=" \
    --inspect-brk=127.0.0.1:$GHOST_DEBUG_PORT" \
    node current/index.js
Starting node with debugger
-
Using NodeJS Debugger
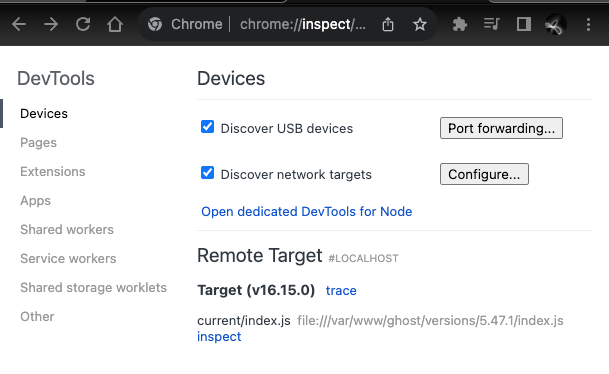
With the five steps complete, you can now connect connect the chrome debugger using the URL chrome://inspect and selecting current/index.js
Because we are using the developement build, source maps are enabled as defined by source-map-rev3.
This means every JS file is augmented with //# sourceMappingURL=filename.map and this allows ChromeDev Tools to request the map via the debugger protocol.
Now load the page:
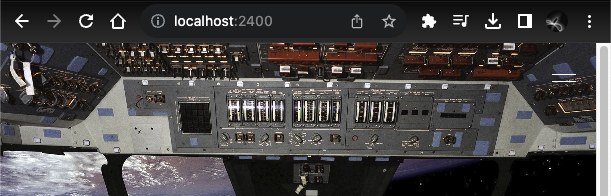
URL for loading development version via tunnel
You should see the debugger hit the breakpoint. From here you can step through and see how it all hangs together.
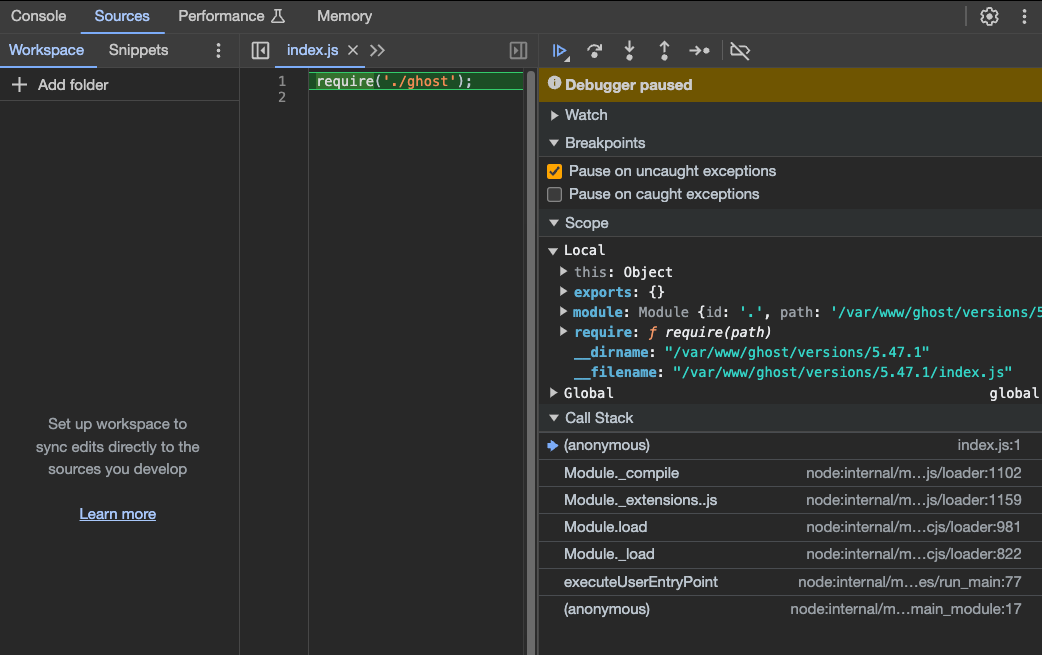
Debugger after starting NodeJS with --inspect=debug-brk:
Note the local require() has properties about the file location. This is the bridge between the ever present node:internal code and the user-defined code with entry point /var/www/ghost/versions/5.47.1/index.js.
See Ghost Debugging 3: Stepping Through Code to focus on the call stack associated with the initiation of the Node.js application.